UNIT-III
CORRELATION
A correlation coefficient is a number between -1 and 1 that tells you the strength and direction of a relationship between variables.
Correlation refers to a process for establishing the relationships between two variables. You learned a way to get a general idea about whether or not two variables are related, is to plot them on a “scatter plot”. While there are many measures of association for variables that are measured at the ordinal or higher level of measurement, correlation is the most commonly used approach.
In other words, it reflects how similar the measurements of two or more variables are across a dataset.
| Correlation coefficient value | Correlation type | Meaning |
|---|---|---|
| 1 | Perfect positive correlation | When one variable changes, the other variables change in the same direction. |
| 0 | Zero correlation | There is no relationship between the variables. |
| -1 | Perfect negative correlation | When one variable changes, the other variables change in the opposite direction. |

Visualizing linear correlations
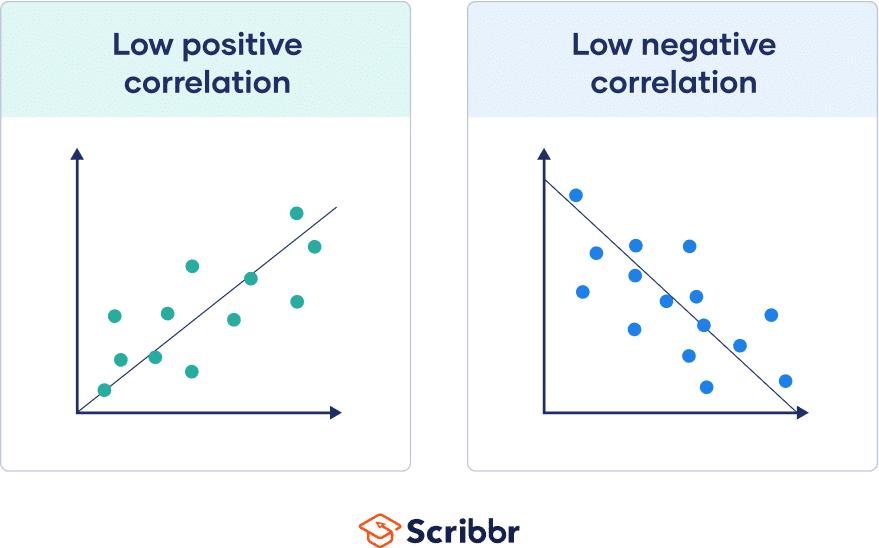
The correlation coefficient tells you how closely your data fit on a line. If you have a linear relationship, you’ll draw a straight line of best fit that takes all of your data points into account on a scatter plot.
The closer your points are to this line, the higher the absolute value of the correlation coefficient and the stronger your linear correlation.
If all points are perfectly on this line, you have a perfect correlation.

If all points are close to this line, the absolute value of your correlation coefficient is high.

If these points are spread far from this line, the absolute value of your correlation coefficient is low.
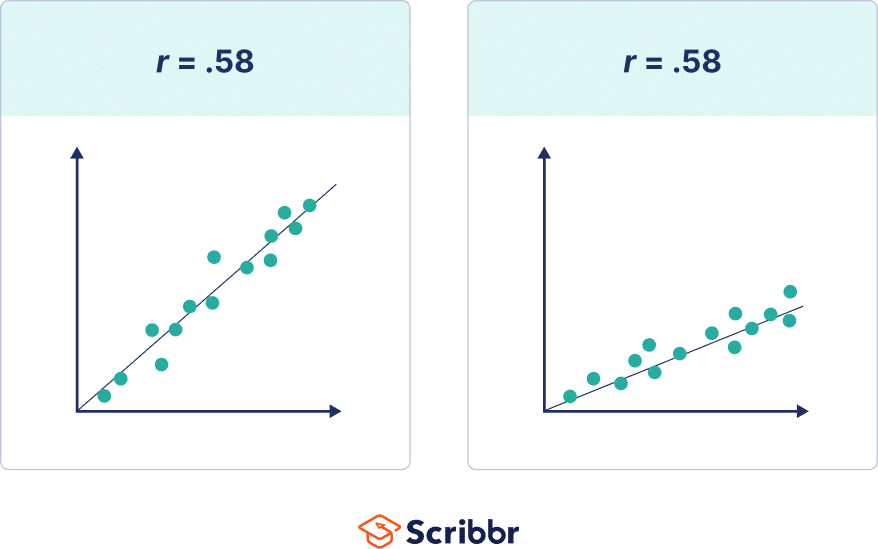
Note that the steepness or slope of the line isn’t related to the correlation coefficient value. The correlation coefficient doesn’t help you predict how much one variable will change based on a given change in the other, because two datasets with the same correlation coefficient value can have lines with very different slopes.
Types of correlation coefficients
You can choose from many different correlation coefficients based on the linearity of the relationship, the level of measurement of your variables, and the distribution of your data.
For high statistical power and accuracy, it’s best to use the correlation coefficient that’s most appropriate for your data.
The most commonly used correlation coefficient is Pearson’s r because it allows for strong inferences. It’s parametric and measures linear relationships. But if your data do not meet all assumptions for this test, you’ll need to use a non-parametric test instead.
Non-parametric tests of rank correlation coefficients summarize non-linear relationships between variables. The Spearman’s rho and Kendall’s tau have the same conditions for use, but Kendall’s tau is generally preferred for smaller samples whereas Spearman’s rho is more widely used.
The table below is a selection of commonly used correlation coefficients, and we’ll cover the two most widely used coefficients in detail in this article.
| Correlation coefficient | Type of relationship | Levels of measurement | Data distribution |
|---|---|---|---|
| Pearson’s r | Linear | Two quantitative (interval or ratio) variables | Normal distribution |
| Spearman’s rho | Non-linear | Two ordinal, interval or ratio variables | Any distribution |
| Point-biserial | Linear | One dichotomous (binary) variable and one quantitative (interval or ratio) variable | Normal distribution |
| Cramér’s V (Cramér’s φ) | Non-linear | Two nominal variables | Any distribution |
| Kendall’s tau | Non-linear | Two ordinal, interval or ratio variables | Any distribution |
Pearson’s r
The Pearson’s product-moment correlation coefficient, also known as Pearson’s r, describes the linear relationship between two quantitative variables.
These are the assumptions your data must meet if you want to use Pearson’s r:
- Both variables are on an interval or ratio level of measurement
- Data from both variables follow normal distributions
- Your data have no outliers
- Your data is from a random or representative sample
- You expect a linear relationship between the two variables
The Pearson’s r is a parametric test, so it has high power. But it’s not a good measure of correlation if your variables have a nonlinear relationship, or if your data have outliers, skewed distributions, or come from categorical variables. If any of these assumptions are violated, you should consider a rank correlation measure.
The formula for the Pearson’s r is complicated, but most computer programs can quickly churn out the correlation coefficient from your data. In a simpler form, the formula divides the covariance between the variables by the product of their standard deviations.
| Formula | Explanation |
|---|---|
|
![\begin{equation*} r = \frac{ n\sum{xy}-(\sum{x})(\sum{y})}{% \sqrt{[n\sum{x^2}-(\sum{x})^2][n\sum{y^2}-(\sum{y})^2]}} \end{equation*}](https://cdn.scribbr.com/wp-content/ql-cache/quicklatex.com-a916dc6277f04e962bf89d6e60f745ec_l3.png "Rendered by QuickLaTeX.com")

 = sample size
 = sum of what follows…
 = every x-variable value
 = every y-variable value
 = the product of each x-variable score and the corresponding y-variable score
Pearson sample vs population correlation coefficient formula
When using the Pearson correlation coefficient formula, you’ll need to consider whether you’re dealing with data from a sample or the whole population.
The sample and population formulas differ in their symbols and inputs. A sample correlation coefficient is called r, while a population correlation coefficient is called rho, the Greek letter ρ.
The sample correlation coefficient uses the sample covariance between variables and their sample standard deviations.
| Sample correlation coefficient formula | Explanation |
|---|---|
|

The population correlation coefficient uses the population covariance between variables and their population standard deviations.
| Population correlation coefficient formula | Explanation |
|---|---|
|

Spearman’s rho
Spearman’s rho, or Spearman’s rank correlation coefficient, is the most common alternative to Pearson’s r. It’s a rank correlation coefficient because it uses the rankings of data from each variable (e.g., from lowest to highest) rather than the raw data itself.
You should use Spearman’s rho when your data fail to meet the assumptions of Pearson’s r. This happens when at least one of your variables is on an ordinal level of measurement or when the data from one or both variables do not follow normal distributions.
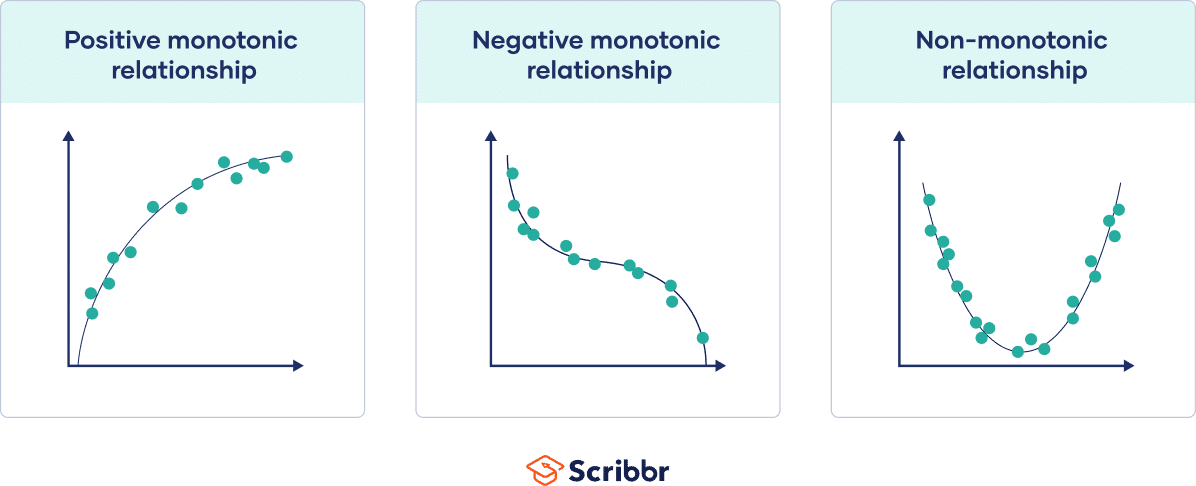
While the Pearson correlation coefficient measures the linearity of relationships, the Spearman correlation coefficient measures the monotonicity of relationships.
In a linear relationship, each variable changes in one direction at the same rate throughout the data range. In a monotonic relationship, each variable also always changes in only one direction but not necessarily at the same rate.
- Positive monotonic: when one variable increases, the other also increases.
- Negative monotonic: when one variable increases, the other decreases.
Monotonic relationships are less restrictive than linear relationships.
Spearman’s rank correlation coefficient formula
The symbols for Spearman’s rho are ρ for the population coefficient and rs for the sample coefficient. The formula calculates the Pearson’s r correlation coefficient between the rankings of the variable data.
To use this formula, you’ll first rank the data from each variable separately from low to high: every datapoint gets a rank from first, second, or third, etc.
Then, you’ll find the differences (di) between the ranks of your variables for each data pair and take that as the main input for the formula.
| Spearman’s rank correlation coefficient formula | Explanation |
|---|---|
|

If you have a correlation coefficient of 1, all of the rankings for each variable match up for every data pair. If you have a correlation coefficient of -1, the rankings for one variable are the exact opposite of the ranking of the other variable. A correlation coefficient near zero means that there’s no monotonic relationship between the variable rankings.
Other coefficients
The correlation coefficient is related to two other coefficients, and these give you more information about the relationship between variables.
Coefficient of determination
When you square the correlation coefficient, you end up with the correlation of determination (r2). This is the proportion of common variance between the variables. The coefficient of determination is always between 0 and 1, and it’s often expressed as a percentage.
| Coefficient of determination | Explanation |
|---|---|
| r2 | The correlation coefficient multiplied by itself |
The coefficient of determination is used in regression models to measure how much of the variance of one variable is explained by the variance of the other variable.
A regression analysis helps you find the equation for the line of best fit, and you can use it to predict the value of one variable given the value for the other variable.
A high r2 means that a large amount of variability in one variable is determined by its relationship to the other variable. A low r2 means that only a small portion of the variability of one variable is explained by its relationship to the other variable; relationships with other variables are more likely to account for the variance in the variable.
The correlation coefficient can often overestimate the relationship between variables, especially in small samples, so the coefficient of determination is often a better indicator of the relationship.
Coefficient of alienation
When you take away the coefficient of determination from unity (one), you’ll get the coefficient of alienation. This is the proportion of common variance not shared between the variables, the unexplained variance between the variables.
| Coefficient of alienation | Explanation |
|---|---|
| 1 – r2 | One minus the coefficient of determination |
A high coefficient of alienation indicates that the two variables share very little variance in common. A low coefficient of alienation means that a large amount of variance is accounted for by the relationship between the variables.
👍
ReplyDelete👍
ReplyDelete👍
ReplyDelete👍
ReplyDelete👍
ReplyDelete👍
ReplyDeleteThenamudhan👍
ReplyDelete👍
ReplyDelete👍🏻
ReplyDeleteThis comment has been removed by the author.
ReplyDeleteInformation Anna
ReplyDelete👍
ReplyDelete👍
ReplyDelete